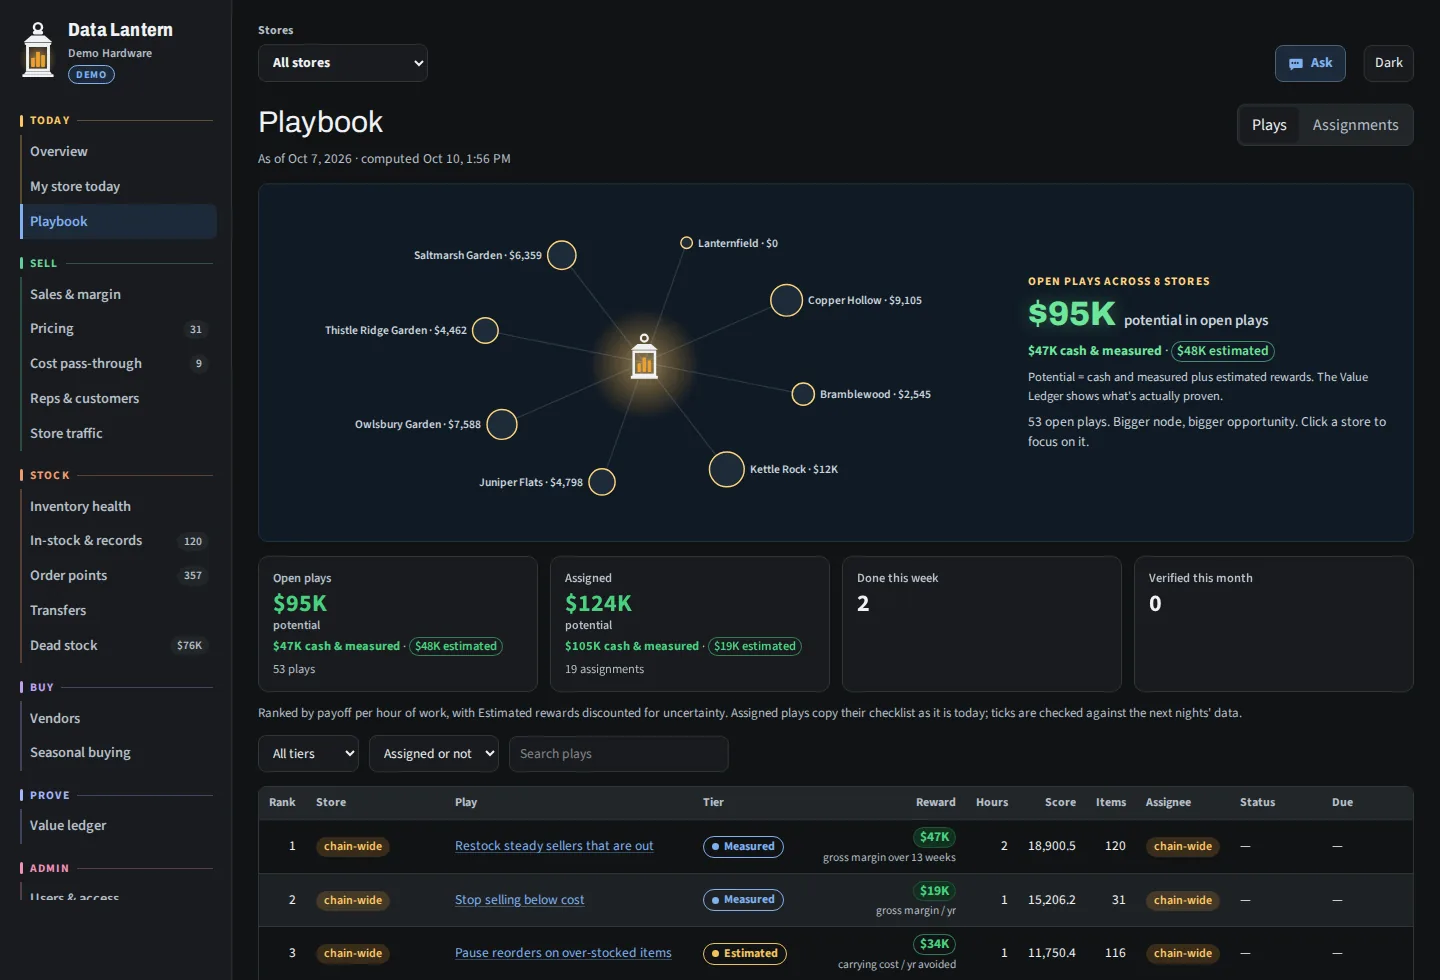
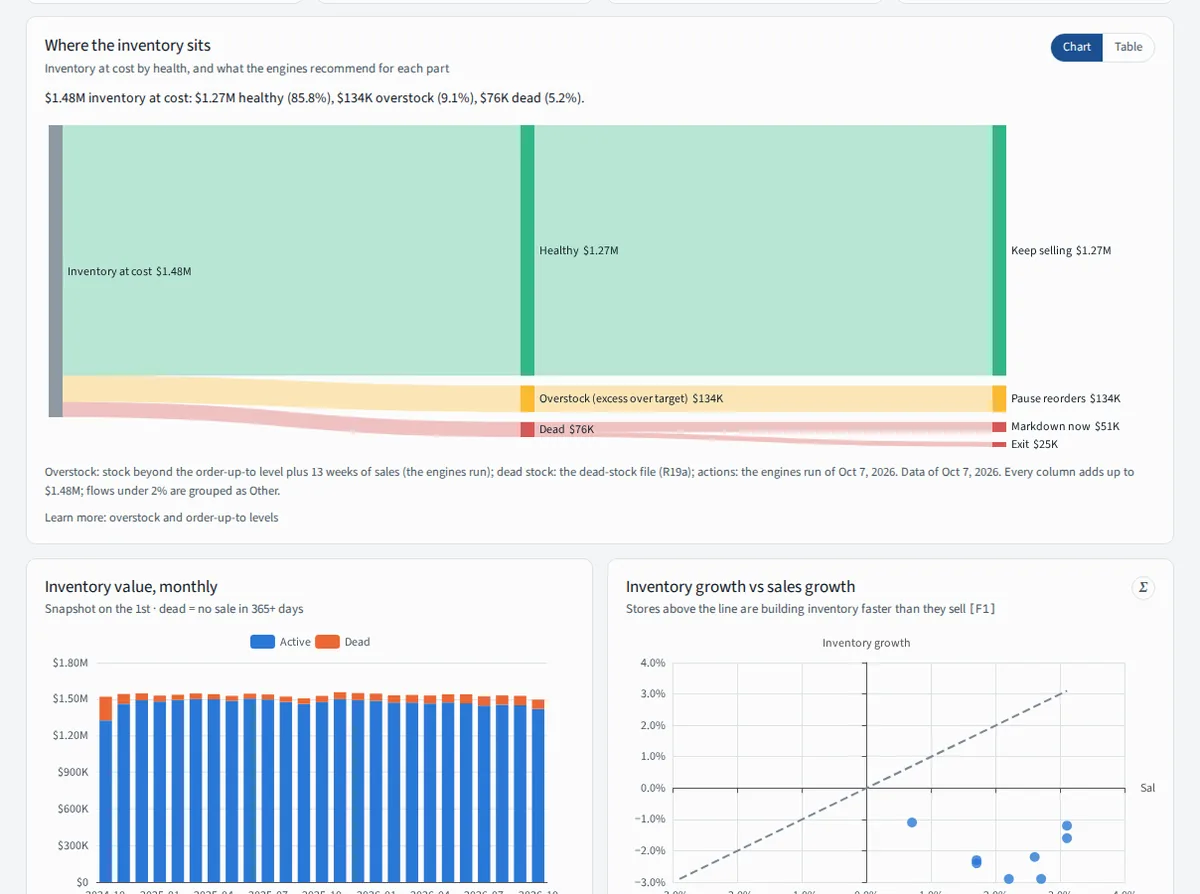
What one night’s run found in our demo chain (Demo Hardware: 8 stores, made-up data, as of Oct 7, 2026)
HOW IT WORKS
From a pile of reports to a to-do list that pays for itself.
The engines run overnight
Sales, stock, prices, costs, vendors and traffic from Compass are checked every night for out-of-stocks, bad records, idle inventory and margin leaks.
Payoff per hour of work
Every play gets a dollar reward and an hour estimate. The list is ranked by payoff per hour, and estimated rewards are discounted for uncertainty.
A checklist for each store
Owners assign plays to stores. Managers work them item by item, on screen or from a printed sheet, and tick them off as they go.
The data checks the work
A tick is only a claim. The next nights’ data verifies it, then measures what it earned, and the result lands in the Value Ledger.
THE PLAYBOOK
A ranked list of what to do, not another dashboard.
Data Lantern turns the numbers into plays with plain names and a price tag. You can see the potential across every store at a glance, assign a play in two clicks, and every play carries its own checklist of items.
Each reward is labelled by how sure we are: Cash, Measured or Estimated.
MY STORE TODAY
Store managers get a checklist they can actually finish.
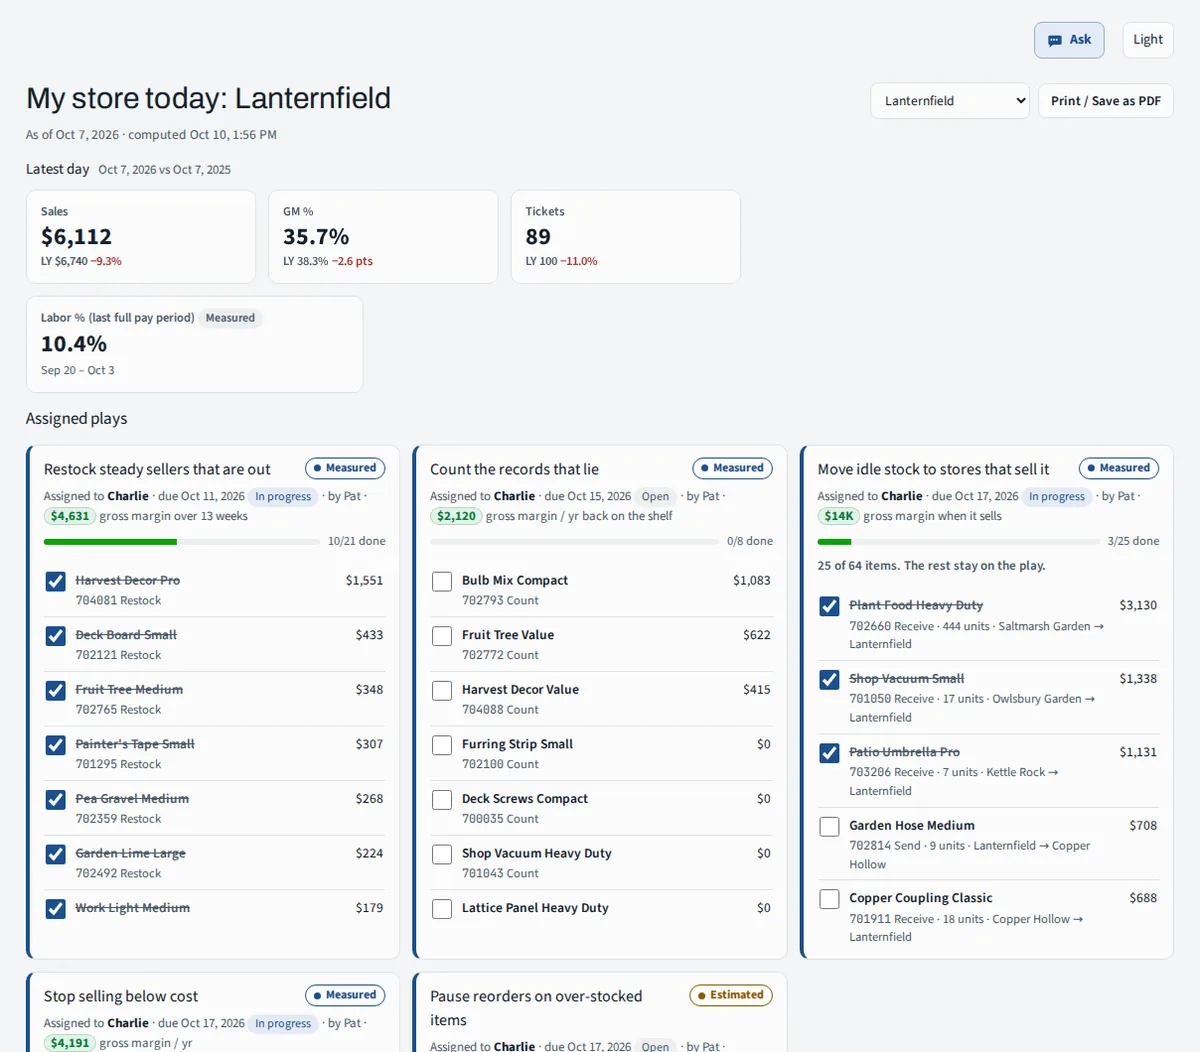
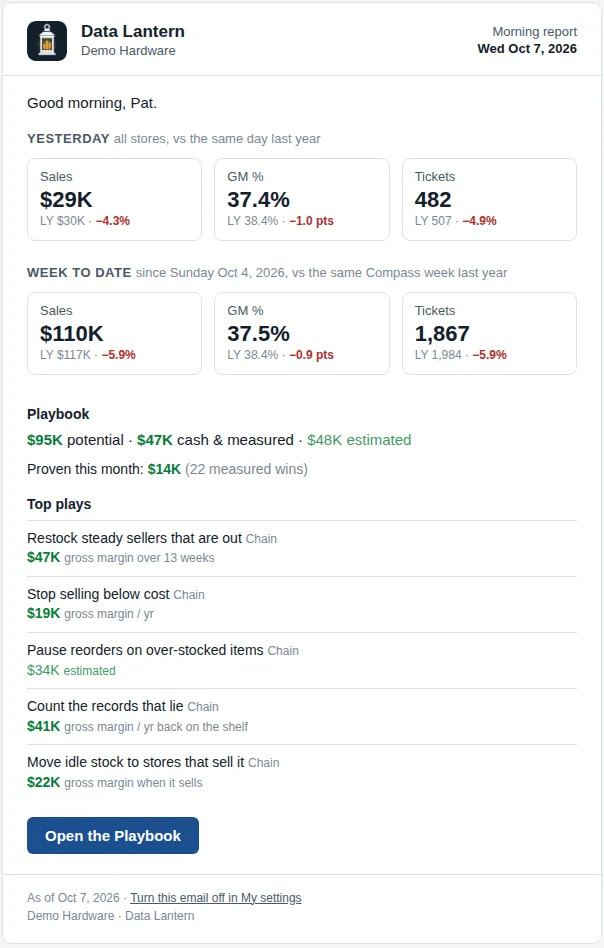
Each manager lands on their own store: yesterday against the same day last year, labor as a share of sales, and the plays assigned to them, item by item with the dollars attached.
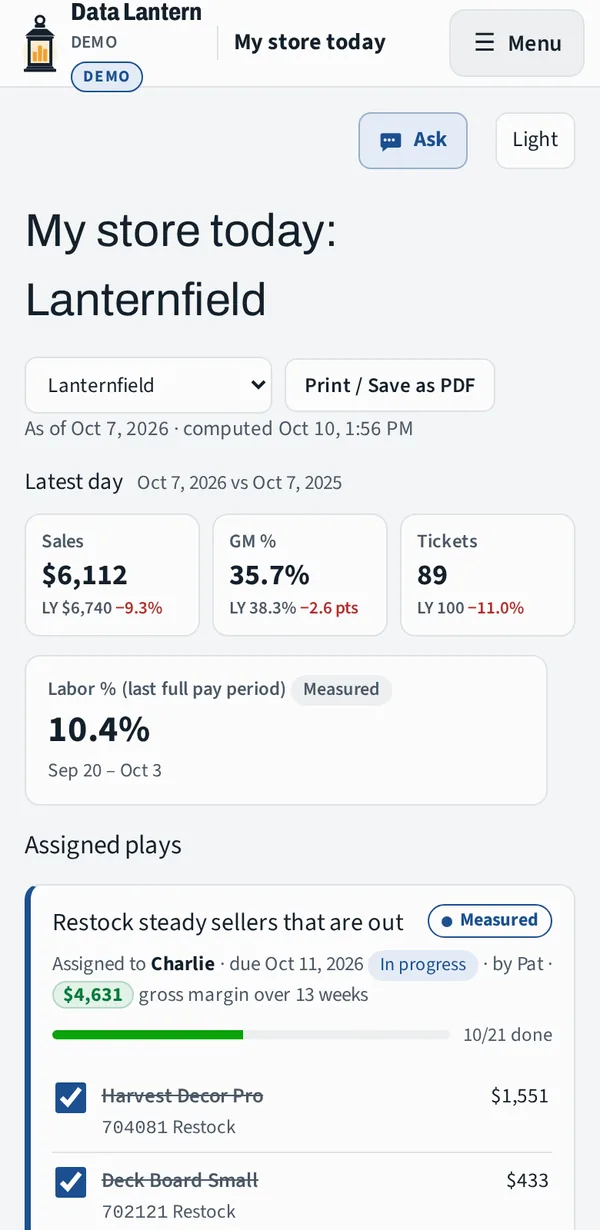
- Works on a phone in the aisle
- Print or save today’s actions as a PDF for the floor
- Transfers say exactly which store sends what, and how many
THE VALUE LEDGER
Most analytics tools promise savings. This one proves them.
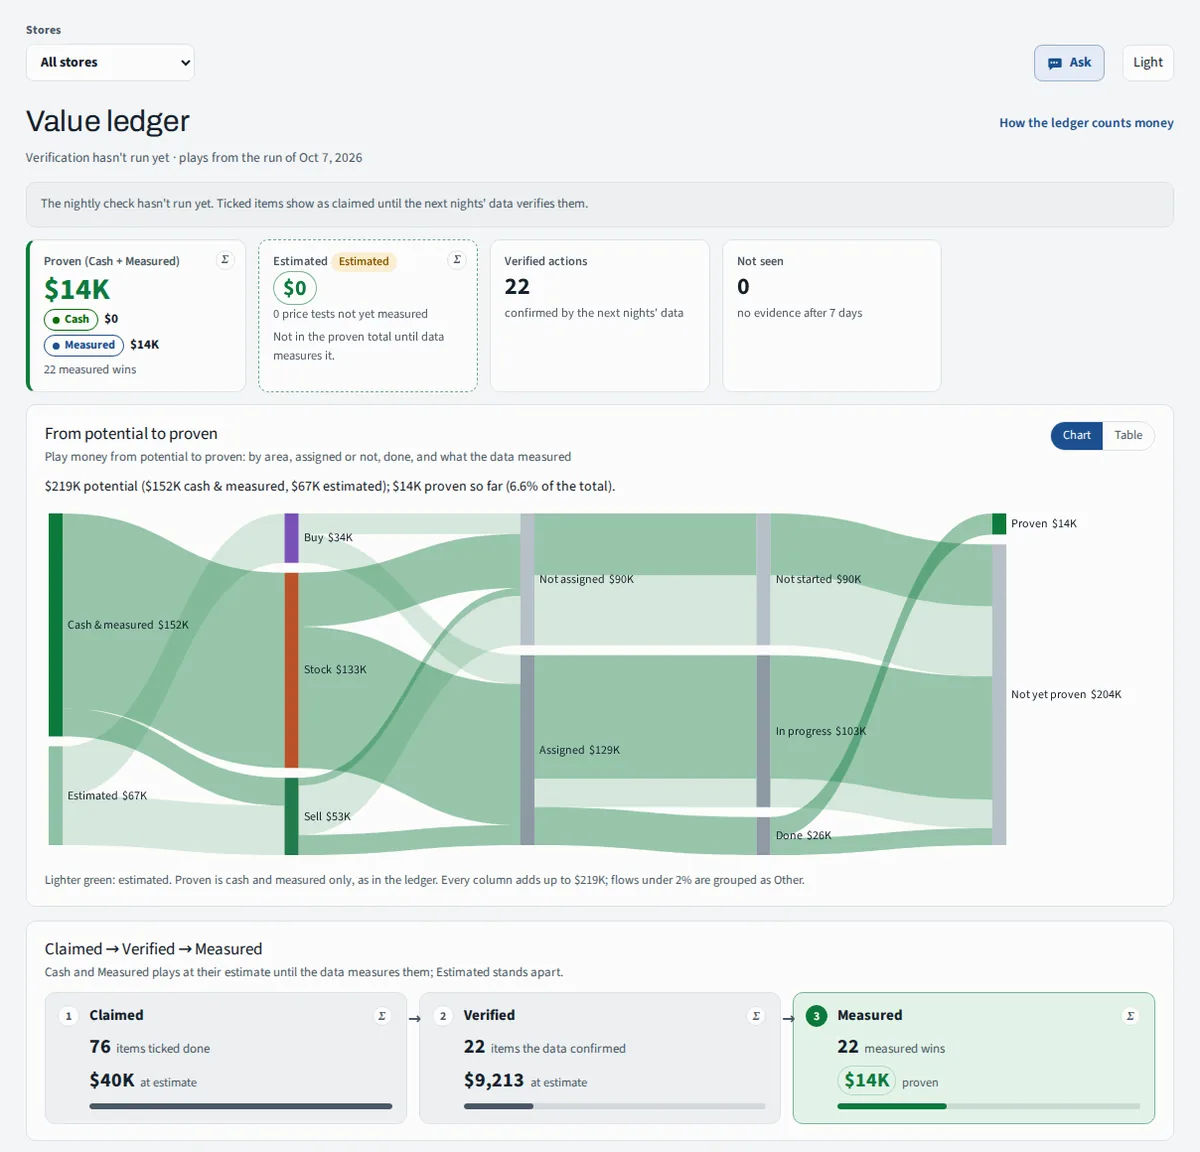
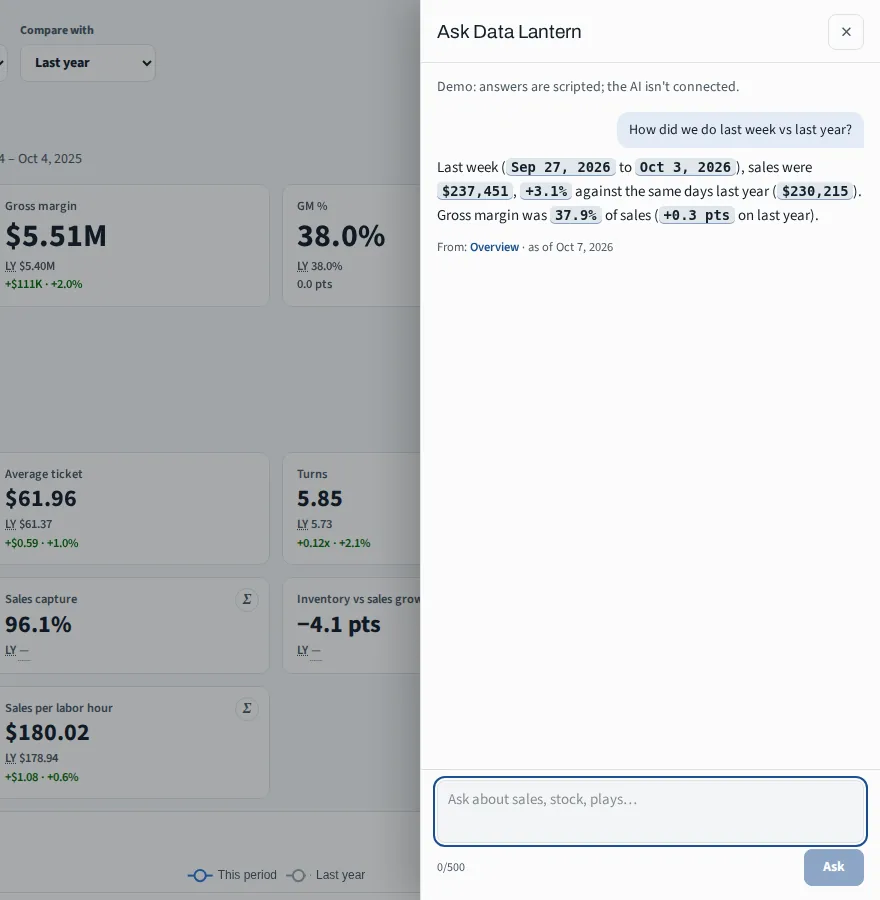
The ledger follows every play’s money from potential to proven. Only Cash and Measured count toward the proven total. Estimated stays to one side until the data measures it, so the headline number is one you can defend to your owner or your banker.
EVERYTHING IN ONE PLACE
Everything in Compass, finally easy to read.
Organized by the job in front of you, and filtered to the stores each person is allowed to see.
TODAY
- Overview
- My store today
- Playbook
SELL
- Sales & margin
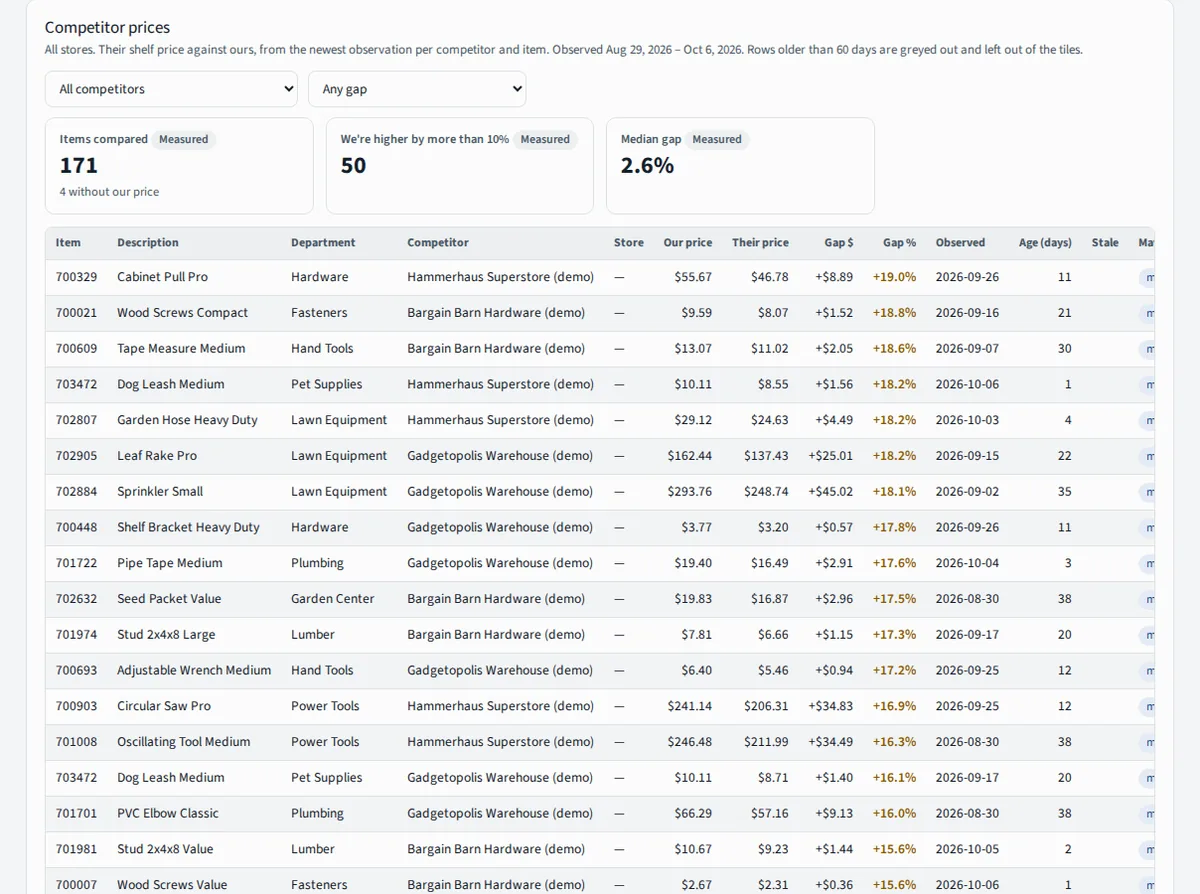
- Pricing & competitor prices
- Cost pass-through
- Reps & customers
- Store traffic
STOCK
- Inventory health
- In-stock & records
- Order points
- Transfers
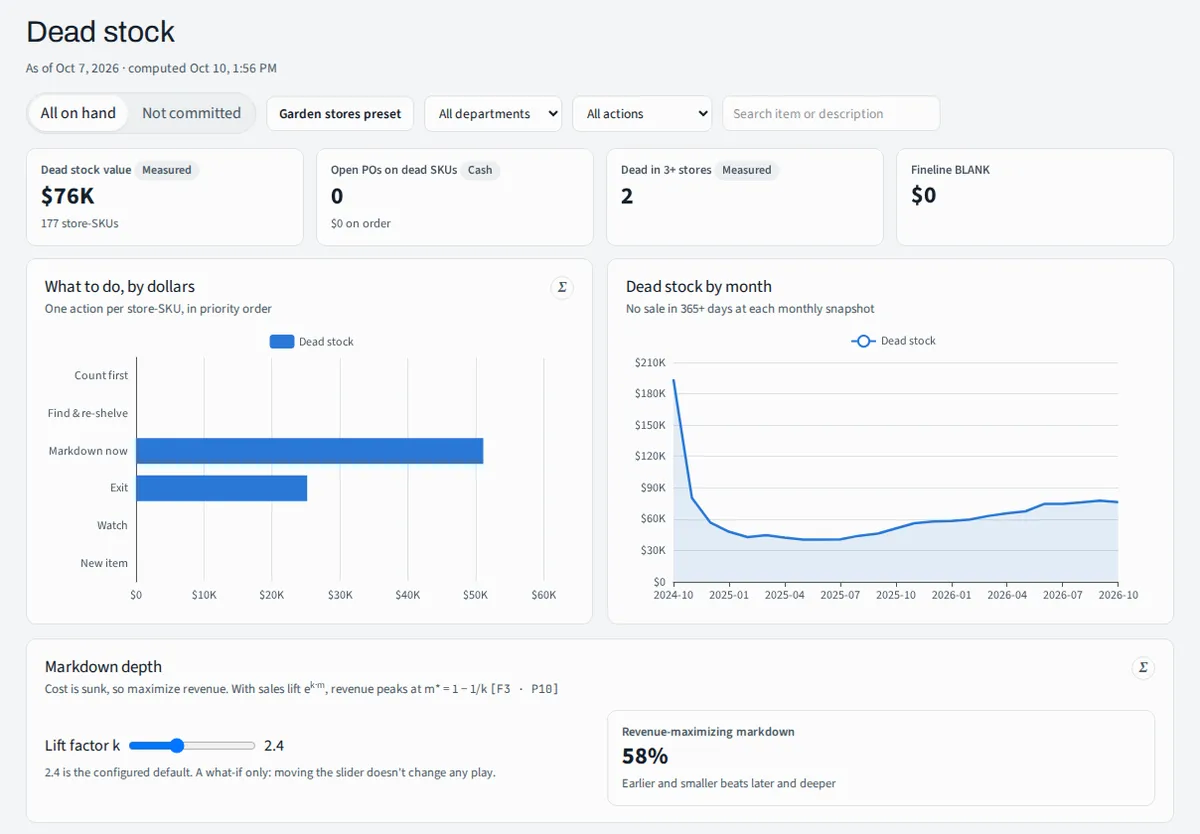
- Dead stock
BUY
- Vendors
- Seasonal buying
PROVE & TRUST
- Value ledger
- Data flow
- Data health
NO BLACK BOX
Every number shows its work.
Tap Σ on any figure to see its formula, its time window and the evidence behind it. The methods come from retail operations research, including The New Science of Retailing by Fisher and Raman: turns, GMROI, order-up-to levels and revenue-maximizing markdowns.
SECURITY & PRIVACY
Your numbers stay yours.
We never sell your data, show ads, or use your data to train AI models.
GETTING STARTED
No new hardware. No new system to learn at the register.
- 1We add a few scheduled exports in Compass.They run early each morning and send files securely to Data Lantern.
- 2Your history loads and the engines run.We load your sales and inventory history, and the first Playbook is built from it.
- 3Your team signs in.Owners, executives, store managers and sales reps each see the stores and pages that fit their job.
BUILT INSIDE AN EAGLE SHOP
Data Lantern was built by people who run Epicor Eagle every day, to answer the questions Compass makes hard.
It runs every morning for a multi-store farm, feed, pet and garden retailer, the chain it was built for.
Diego Mendoza, founder · Ukiah, California
Questions owners ask
Do we have to change anything in Eagle?
No. Data Lantern only reads data from new scheduled Compass exports. Nothing about your registers, your existing reports or the scheduled tasks other people depend on changes.
Who sees what?
You decide. Store managers land on their own store and only see their stores. Sales reps see their own sales and accounts. Owners and executives see the whole chain.
Do we have to use the AI?
No. The Playbook, the Value Ledger and every page work without it. Ask Data Lantern is optional. When you turn it on, it receives business figures and store, item and vendor names, never customer names, staff contact details or financial statements.
Can we try it first?
Yes. The live demo runs on a made-up 8-store hardware and garden chain, reset every night. Click around, assign a play, tick it off.
What does it cost?
It depends on how many stores you run and what you need. Email hello@datalantern.ai and we’ll walk through the options together.
See your own stores, lit up.
Bring a question you can’t answer from Compass today. We’ll show you the Playbook on a real chain and talk through what it would find in yours.
Or email hello@datalantern.ai